Achieving nanometre axial super-localization is still a major challenge, as diffraction imposes large depths-of-fields. We demonstrate fast full three-dimensional nanometre super-localization of gold nanoparticles through simultaneous intensity and phase imaging with a wavefront-sensing camera based on quadriwave lateral shearing interferometry. We combine the intensity and phase information to provide the key to the third axial dimension. Presently, we demonstrate even in the occurrence of large three-dimensional fluctuations of several microns, unprecedented sub-nanometre localization accuracies down to 0.7 nm in lateral and 2.7 nm in axial directions at 50 frames per second. This nanoscale stabilization greatly enhances the image quality and resolution in direct stochastic optical reconstruction microscopy (dSTORM) imaging.
This work has been developed by Pierre Bon during his postdoc position (now at LP2N, IOGS Bordeaux) and involves different labs : ISMO, Institut Langevin, CPBM and Intsitut Fresnel
Associated publication : Three-dimensional nanometre localization of nanoparticles to enhance super-resolution microscopy, Pierre Bon, Nicolas Bourg, Sandrine Lécart, Serge Monneret, Emmanuel Fort, Jérôme Wenger & Sandrine Lévêque-Fort
http://www.nature.com/ncomms/2015/150727/ncomms8764/full/ncomms8764.html
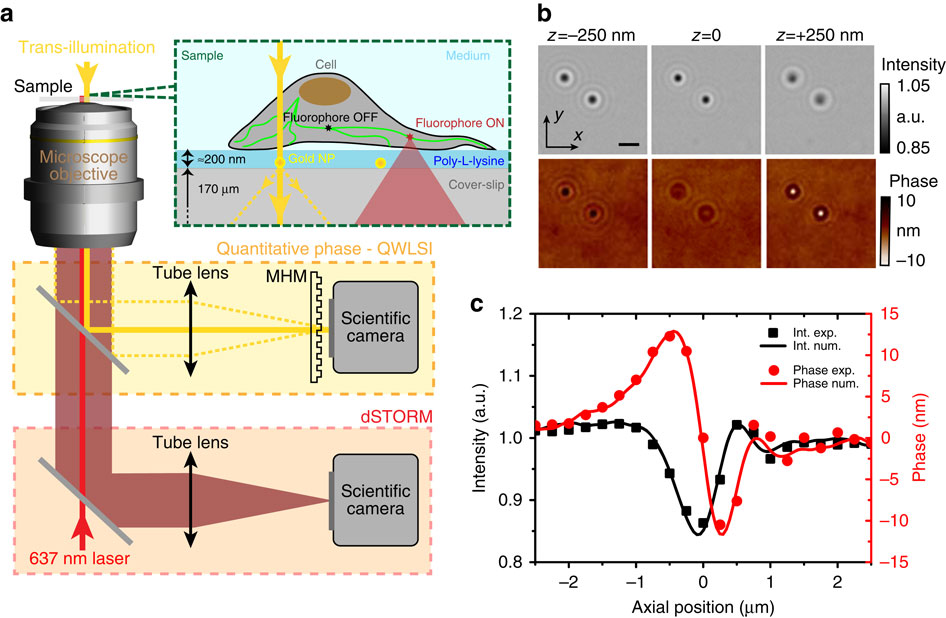 a) Schematic of the optical set-up and sample. The microscope port highlighted in yellow is dedicated to intensity and phase imaging of nanoparticles in transillumination using the microscope lamp, with MHM the acronym for Modified Hartman Mask. The port highlighted in red corresponds to dSTORM imaging. (b) Intensity and phase images of two 100 nm gold nanoparticles, in-focus (z=0) or slightly defocused (z=±250 nm). Note the contrast inversion in the phase images on defocusing and the weak variations of the intensity signal. The scale bar, 2 μm. (c) Intensity (black squares) and phase (red dots) response of a single 100 nm gold nanoparticle recorded versus the mechanical sample displacement. Lines are the results of the numerical propagation computed using the z=0 plane data only; they are not numerical fits to the experimental data.
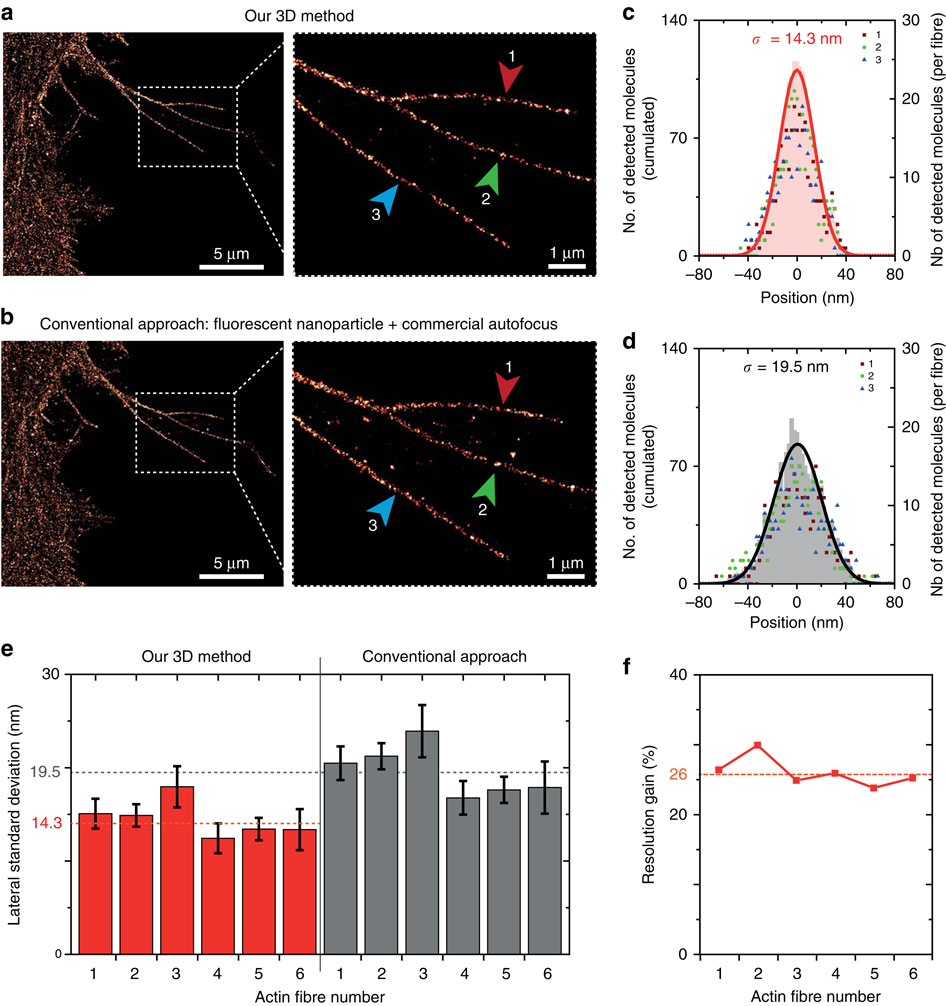 (a) Image of labelled F-Actin in CHO cells obtained using our 3D stabilization technique. The insert shows the fibres used for assessing the dSTORM resolution (indicated by the arrows 1, 2 and 3). (b) Same as a using a conventional drift correction technique combining a commercial autofocus (Nikon Perfect Focus) and 2D lateral stabilization using fluorescent nanoparticle tracking (artificial star). (c,d) Histograms of the molecule positions deduced from the data in a,b, respectively. The number of detected events is similar in both cases. Data points correspond to the individual fibres highlighted in the inserts in a,b, the shaded area denotes the cumulated data and the line is a Gaussian fit used to determine the localization s.d. σ. (e) s.d. found for the different fibres using the two methods. The fibres 1–3 are shown in a,b, the fibres 4–6 are displayed in Supplementary Fig. 3. The dashed horizontal lines indicate the average value found for each method, demonstrating a better resolution with our method. (f) dSTORM resolution improvement computed for each actin fibre as the ratio of the s.d. values in e. An average gain of 26% is obtained.